

MODEL OVERVIEW
User-friendly Excel Calculator to calculate the expected value and return for a portfolio of equity investments using Monte Carlo simulation analysis. The model allows the user to specify individual equity investment holdings (up to 15 different currency holdings), expected return, expected standard deviation and the investment period to calculate a distribution of the expected total return and investment balance at the end of the investment period using Monte Carlo simulation.
The model uses Microsoft Excel Stock Data Type to automatically retrieve current/live and historical stock information to compute portfolio metrics/composition outputs and help determine / sense-check key projection assumptions including standard deviation and investment return. IMPORTANT: IN ORDER FOR STOCK DATA FUNCTION TO WORK, A MICROSOFT 365 SUBSCRIPTION IS REQUIRED.
The model follows best practice financial modelling principles and includes instructions, checks and input validations
KEY OUTPUTS
- Distribution chart of investment balances at end of investment period;
- Distribution chart of the total investment return over the investment period;
- Chart showing investment holding breakdown for a single iteration across investment period;
- Key results/ratios including average investment balance, average investment return, historic average return and historic standard deviation;
- Table showing total investment balance and investment return across key percentiles
- Table showing average development of investment balance over projection period.
- Table and charts showing current portfolio composition and key metrics including historical price movement and volume charts.
KEY INPUTS
- Currency
- Date of analysis
- Projection years
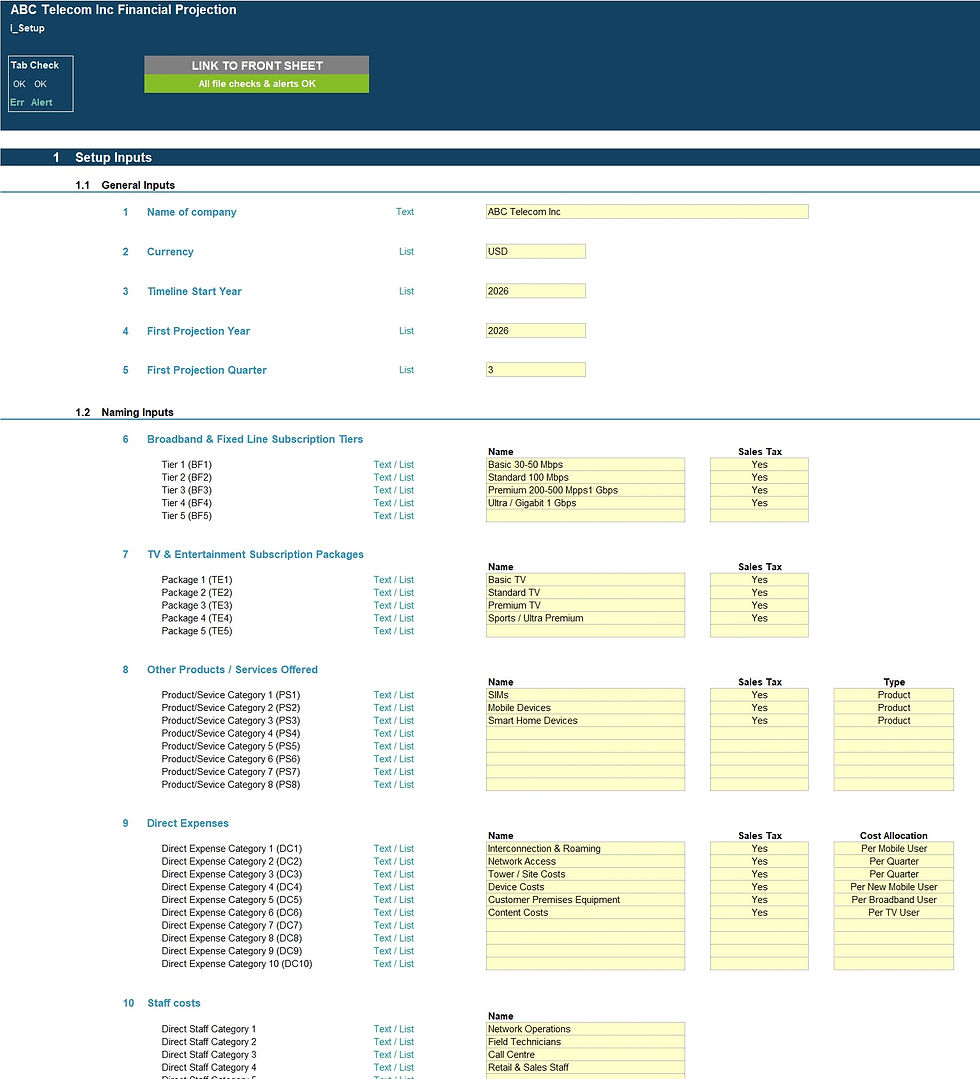
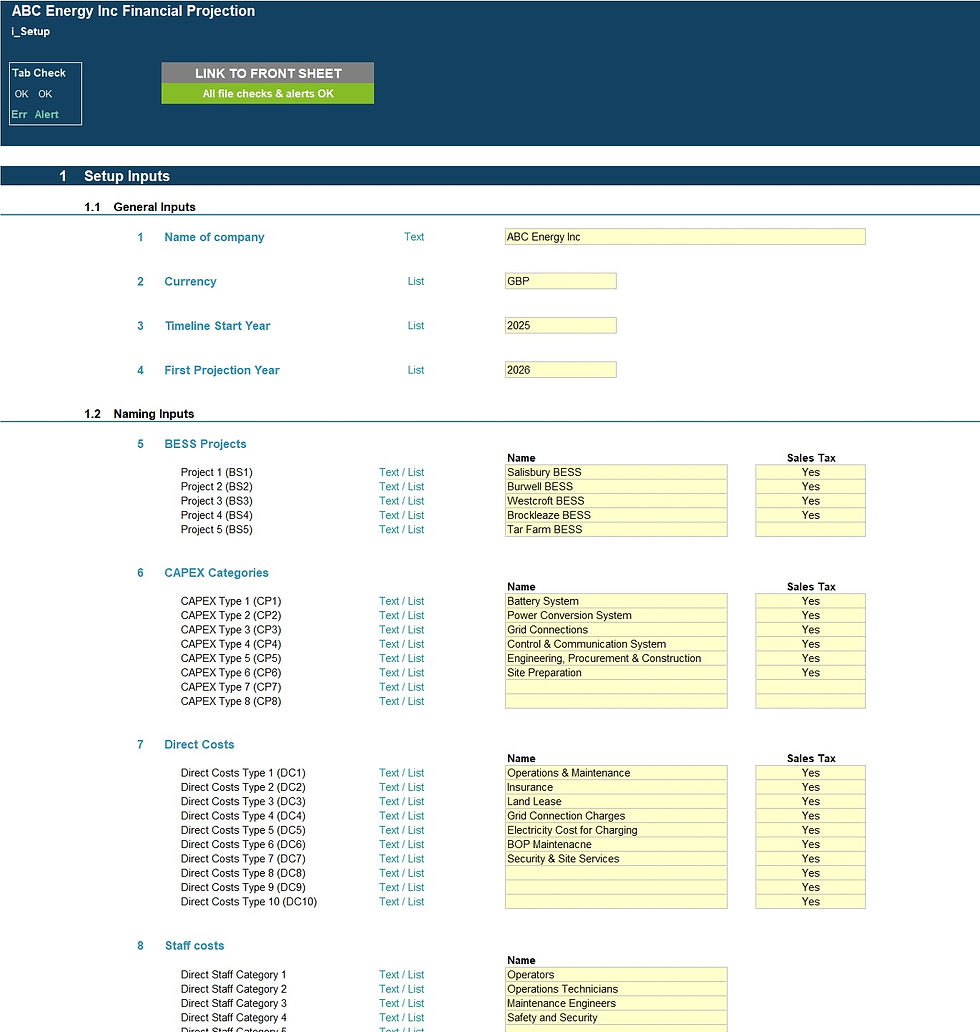
- Portfolio composition (tickers and current investment balance by holding)
- Expected standard deviation
- Expected average return
- Expected inflation rates
MODEL STRUCTURE
The model contains, 6 tabs split into input ('i_'), calculation ('c_'), output ('o_’) and system tabs. The tabs to be populated by the user is the input tab ('i_Inputs'). The calculation tabs use the user-defined inputs to calculate and produce the projection outputs which are presented in ‘o_Results’
KEY FEATURES
- The model follows best practice financial modelling guidelines and includes instructions, checks and input validations;
- The model allows for a maximum remaining investment period of 5 years;
- The model uses Monte Carlo analysis to simulate the investment return and balances for up to 1,000 iterations;
- Portfolio composition (investment holdings), currency, calculation year are fully customisable;
- The Model includes a prepopulated list containing the largest c.1500 stocks by market capitalisation across US, Europe and Asia Pacific, which can be extended by the model users if required;
- The model includes instructions, checks and input validations to help ensure input fields are populated accurately;
- The model includes a checks dashboard which summarises all the checks included in the various tabs making it easier to identify any errors.
MODIFICATIONS & SUPPORT
If you require any be-spoke modifications or support, we are more than happy to assist. Please send us a message below or contact us on hello@useprojectify.com
Equity Portfolio Investment Return Calculator
1 Populated Excel Model and 1 Unpopulated Excel Model


