

MODEL OVERVIEW
Highly versatile and user-friendly Excel model for the preparation of a rolling 3 statement (Income Statement, Balance Sheet and Cash flow Statement) financial projection for a startup or existing business generating revenue from selling subscription products/services.
The model allows the user to model up to 5 different subscription products/services. The model follows best practice financial modelling principles and includes instructions, line item explanations, checks and input validations.
KEY OUTPUTS
- Projected full financial statements (Income Statement, Balance Sheet and Cash flow Statement) presented on a quarterly basis across up to 5 years and summarised on an annual basis.
- Dashboard with:
- Summarised projected Income Statement and Balance Sheet;
- Compounded Annual Growth rate (CAGR) for each summarised income statement and Balance Sheet line item;
- List of key ratios including average revenue growth, average profit margins, average return on assets and equity and average debt to equity ratio;
- Bar charts summarising income statement and Balance Sheet projections;
- Chart presenting revenue mix and total users per month
- Gross profit by income source.
KEY INPUTS
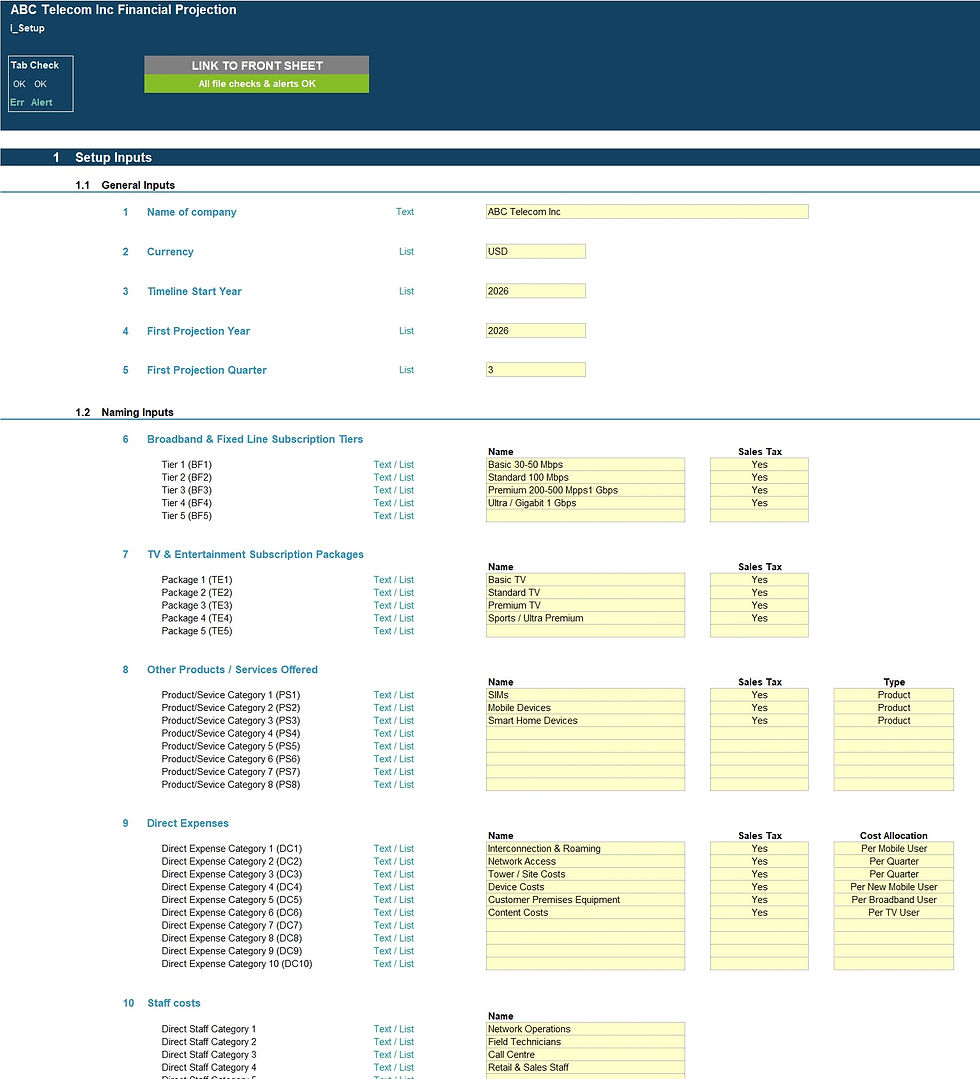
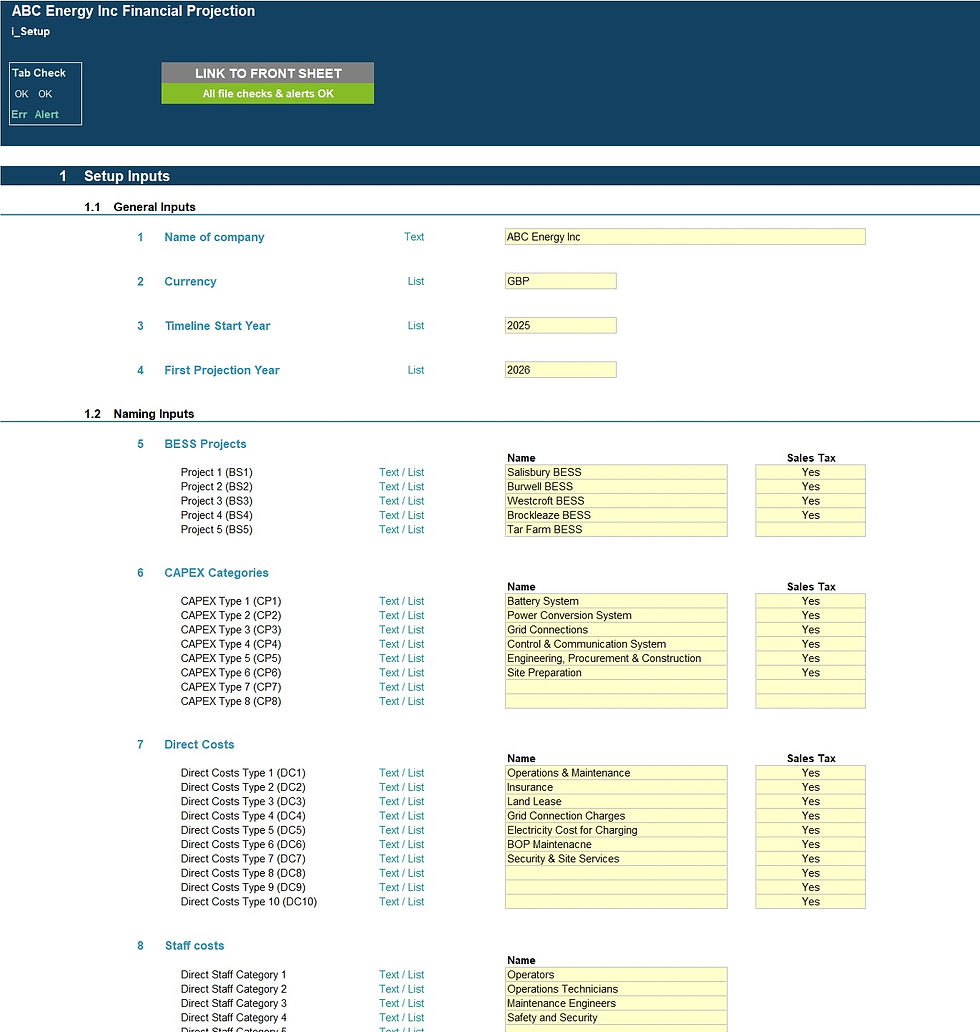
Setup Inputs:
- Name of business;
- Currency;
- First projection year and quarter;
- App names, variable costs, staff cost, fixed costs, fixed assets and borrowings;
- Sales tax applicability for revenue and cost categories;
Actuals Inputs:
- Opening balance sheet (for existing businesses);
- Income Statement actuals (for trend analysis);
Projection Inputs:
- Revenue
- New Users;
- Free trial to paid user conversion rate;
- Monthly, annual, quarterly subscription mix;
- Renewal rates;
- Subscription prices.
- Variable Costs including:
- Cost per app sale;
- Annual fees per app;
- Other cost inputs including
- Marketing costs
- Staff costs
- Other costs
- Sales and corporate tax inputs including rate and payment periods;
- Dividend inputs including amount or percentage of retained earnings and frequency;
- Fixed Assets including addition amounts and useful life;
- Borrowings including addition/redemption amounts and interest rate;
- Share Capital additions.
MODEL STRUCTURE
The model comprises of 9 tabs split into input ('i_'), calculation ('c_'), output ('o_’) and system tabs. The tabs to be populated by the user are the input tabs ('i_Setup', ‘i_Actuals’ and 'i_Assumptions'). The calculation tab uses the user-defined inputs to calculate and produce the projection outputs which are presented in 'o_Fin Stats', ‘o_Charts’ and ‘o_DCF’.
KEY FEATURES
- The model follows best practice financial modelling guidelines and includes instructions, line item explanations, checks and input validations;
- The model is not password protected and can be modified as required following download;
- The model contains a dynamic timeline that allows for a mix of actual and forecast period across a 5-year period allowing projections to be rolled forward from month to month;
- Timeline is split on a monthly basis and summarised on an annual basis;
- Costs are split into: variable and fixed for better driver-based forecasting;
- The model allows for the following number of underlying categories for each line item (these can be easily expanded if required):
- Subscription Products – 5 products;
- Variance costs – 5 categories (1 for each subscription product)
- Staff costs – 8 categories;
- Marketing costs – 5 categories;
- Other expenses – 15 categories;
- Fixed Assets – 5 categories;
- Borrowings – 3 facilities;
- Apart from projecting revenue and costs the model includes the possibility to model inventory, deferred income, payables, fixed assets, borrowings, dividends, corporate tax and sales tax;
- The model included an integrated discounted cash flow valuation using the projected cash flow outputs;
- Business name, currency, starting projection period are fully customisable;
- Revenue, cost, fixed asset and Borrowing category descriptions are fully customisable;
- The model includes instructions, line item explanations, checks and input validations to help ensure input fields are populated accurately;
- The model includes a checks dashboard which summarises all the checks included in the various tabs making it easier to identify any errors.
MODIFICATIONS & SUPPORT
If you require any be-spoke modifications or support, we are more than happy to assist. Please send us a message below or contact us on hello@useprojectify.com
Subscription Business Financial Projection - Excel Models
https://youtu.be/laAmn1u2CfU
1 Populated Excel Model and 1 Unpopulated Excel Model


