

MODEL OVERVIEW
An AI-native platform is a software business built entirely around artificial intelligence as its core value driver, offering tools, APIs, or applications that enable users to access, integrate, or build on top of AI capabilities such as natural language processing, computer vision, or generative models. These platforms often operate on a usage-based or subscription pricing model and may serve developers, enterprises, or end users across industries.
Our highly versatile and user-friendly Excel model allows for the preparation of a of 5-year rolling 3 statement financial projection with a monthly timeline for a startup or existing AI-Native platform business offering subscription and/or usage-based and/or API access products.
The model allows the user to model 8 different subscription tiers/products, 8 different usage-based products/tiers, 5 API Access Products together with other income, direct expenses, R&D Costs, staff costs, marketing costs, other operating costs, fixed assets, borrowings, sales tax, corporate tax and dividend distributions.
The model follows good practice financial modelling principles and includes instructions, line item explanations, checks and input validations and incorporates a discounted cash flow valuation calculation using the projected cash flows.
KEY OUTPUTS
- Projected full financial statements (Income Statement, Balance Sheet and Cash flow Statement) presented on a monthly basis across 5 years and summarised on an annual basis.
- Dashboard with:
- Summarised projected Income Statement and Balance Sheet;
- Compounded Annual Growth Rate (CAGR) for each summarised income statement and balance sheet line item;
- List of key subscription metrics including Average Revenue Per Customer (ARPU), Monthly Recurring Revenue (MRR), Annual Recurring Revenue (ARR), Churn Rate, Customer Lifetime Value (LTV) and Customer Acquisition Cost (CAC);
- Other key ratios including average revenue growth, average profit margins, average return on assets and equity and average debt to equity ratio;
- Tables and Bar charts summarising revenue, direct expenses and user volumes by product;
- Charts and graphs showing: cash balance by month, free cash flow generation, cash flow statement breakdown, profit margins, income statement breakdown, net cash vs net income, working capital, valuation and capital structure.
- Discounted cash flow valuation using the projected cash flow output.
- Breakeven analysis
KEY INPUTS
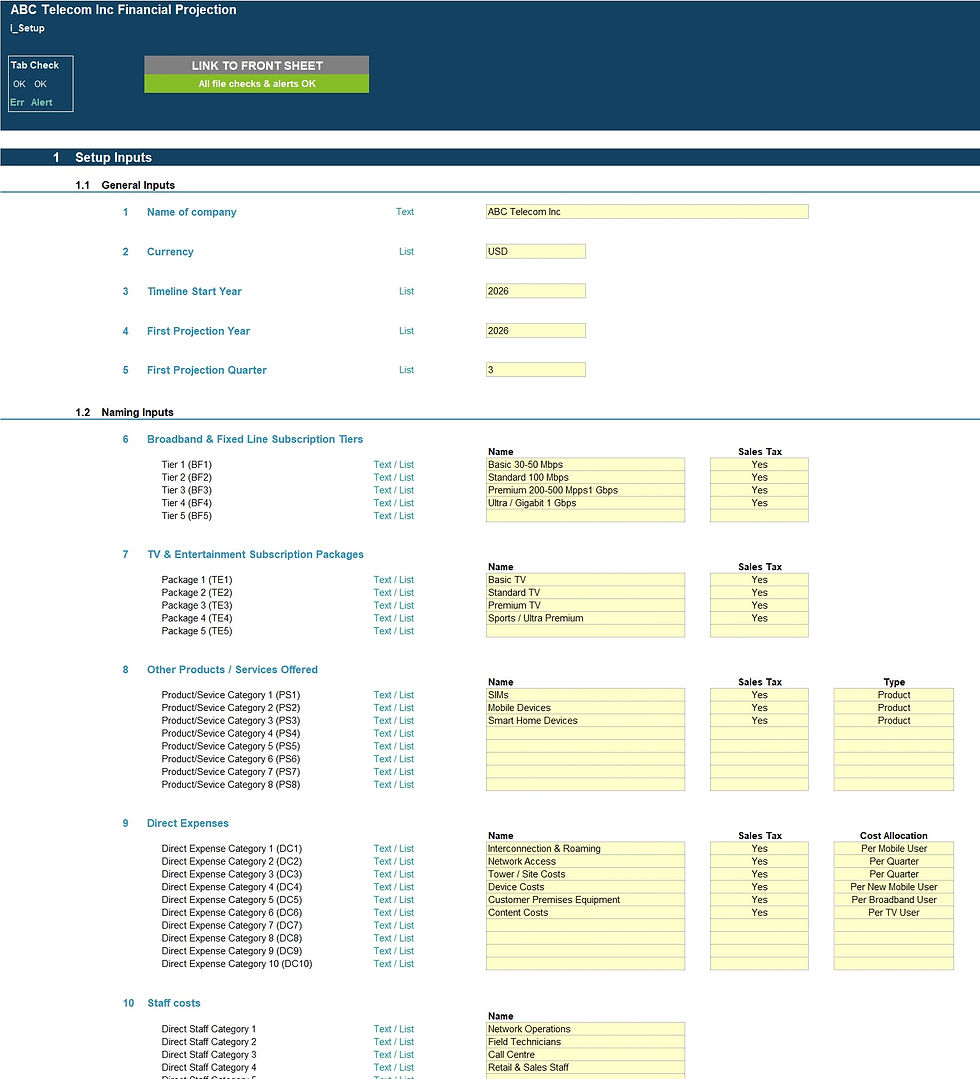
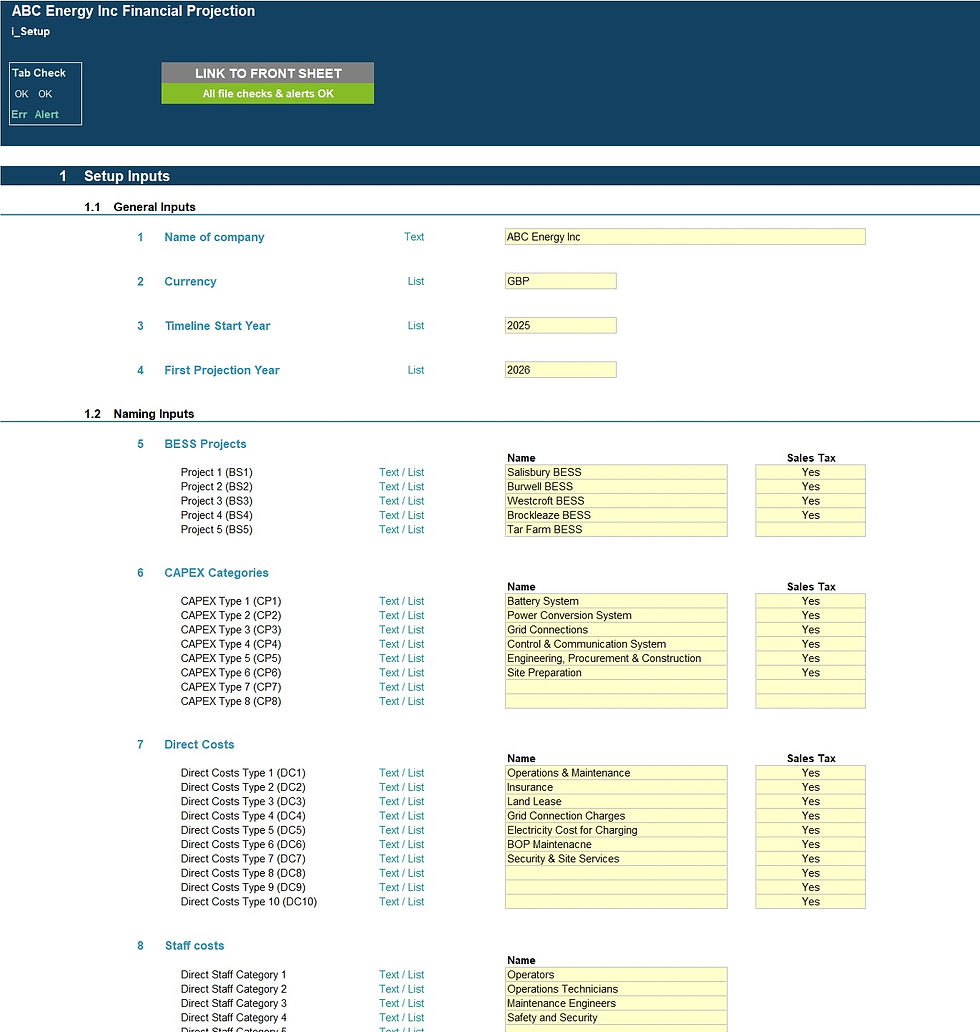
Setup Inputs:
- Name of business;
- Currency;
- First projection year and month;
- Naming for subscription tiers, Usage-based pricing tiers, API access tiers, direct expenses, staff costs, R&D costs, marketing costs, other operating costs, fixed assets and borrowings;
Actuals Inputs:
- Opening balance sheet (for existing businesses);
- Income Statement actuals (for trend analysis);
Projection Inputs:
- Subscription-based product assumptions including new subscribers, payment plans (monthly or annual), churn rates, subscription rates and free trial to paid user conversion ratio;
- Usage-based product assumptions including number of users, average usage volumes, minimum usage volumes and rate per unit;
- API Access Revenue assumptions including number of users, API Calls and rate per unit;
- Direct expenses calculated based on number of active users, usage or amount per annum basis.
- Staff cost inputs including staff numbers, average salary per full time position, average employer’s social security percentage of salary, average annual bonus and bonus payment months.
- Other income and costs inputs including R&D costs (expensed and capitalizable), marketing costs and other operating costs;
- Sales and corporate tax inputs including rate and payment periods;
- Dividend inputs including amount (percentage of retained earnings) and frequency;
- Fixed assets including addition amounts and useful life;
- Borrowings including addition amounts, interest rate and maturity date;
- Share capital additions;
- Discount rate inputs (for valuation calculation).
KEY FEATURES
- The model contains a flexible timeline that allows for a mix of actual and forecast periods across a 5-year period. This allows projections to be easily rolled forward as forecast periods become actual period;
- Timeline is split on a monthly basis and summarised on an annual basis;
- The model is not password protected and can be modified as required following download;
- The model is reviewed using specialised model audit software to help reduce risk of formula inconsistencies;
- The model allows for the following number of underlying categories for each line item (these can be easily expanded if required):
- Subscription tiers/products – 8 types;
- Usage-based tiers/products – 8 types;
- API access tiers – 8 types;
- Other income categories – 5 categories;
- Direct expenses – 10 categories (5 for each revenue stream);
- Staff costs – 10 categories;
- R&D Costs – 8 categories;
- Marketing costs – 5 categories;
- Other expenses – 15 categories;
- Fixed assets – 5 categories;
- Borrowings – 3 facilities
- Apart from projecting revenue and costs the model includes the possibility to model fixed assets, borrowings (amortising), dividends and corporate tax;
- Business name, currency, starting projection period are fully customisable;
- Revenue, cost and fixed asset descriptions are fully customisable;
- The model included an integrated discounted cash flow valuation using the projected cash flow outputs;
- The model includes instructions, line-item explanations, checks and input validations to help ensure input fields are populated accurately;
- The model includes a checks dashboard which summarises all the checks included in the various tabs making it easier to identify any errors.
SUPPORT / MODIFICATIONS
If you require any be-spoke modifications or support, we are more than happy to assist. Please send us a message below or contact us on hello@useprojectify.com
AI-Native Platform 5-Year 3 Statement Financial Projection Model
1 Excel model with populated example and 1 blank Excel model


