

MODEL OVERVIEW
Highly versatile and user-friendly Excel model for the preparation a of 50-year 3 statement (Income Statement, Balance Sheet and Cash flow Statement) financial projection with a yearly timeline for an orchard / Crop farming business generating revenue through the growing and selling of produce.
The model allows the user to model the production and sale of up to 8 orchard or crop produce across 2 scanerios. The model includes 10 variable cost items that can be calculated on produce quality, sale quantity or land area.
The model follows good practice financial modelling principles and includes instructions, line item explanations, checks and input validations and incorporates a discounted cash flow valuation calculation using the projected cash flows.
KEY OUTPUTS
- Projected full financial statements (Income Statement, Balance Sheet and Cash flow Statement) presented on a yearly basis up to 50 years.
- Dashboard with:
- Summarised projected Income Statement and Balance Sheet;
- Compounded Annual Growth Rate (CAGR) for each summarised income statement and balance sheet line item;
- List of key ratios including average revenue growth, average profit margins, average return on assets and equity and average Debt to Equity ratio;
- Bar charts summarising income statement and balance sheet projections;
- Gross Profit margin by produce type in table and bar-chart format
- Discounted cash flow valuation using the projected cash flow output.
KEY INPUTS
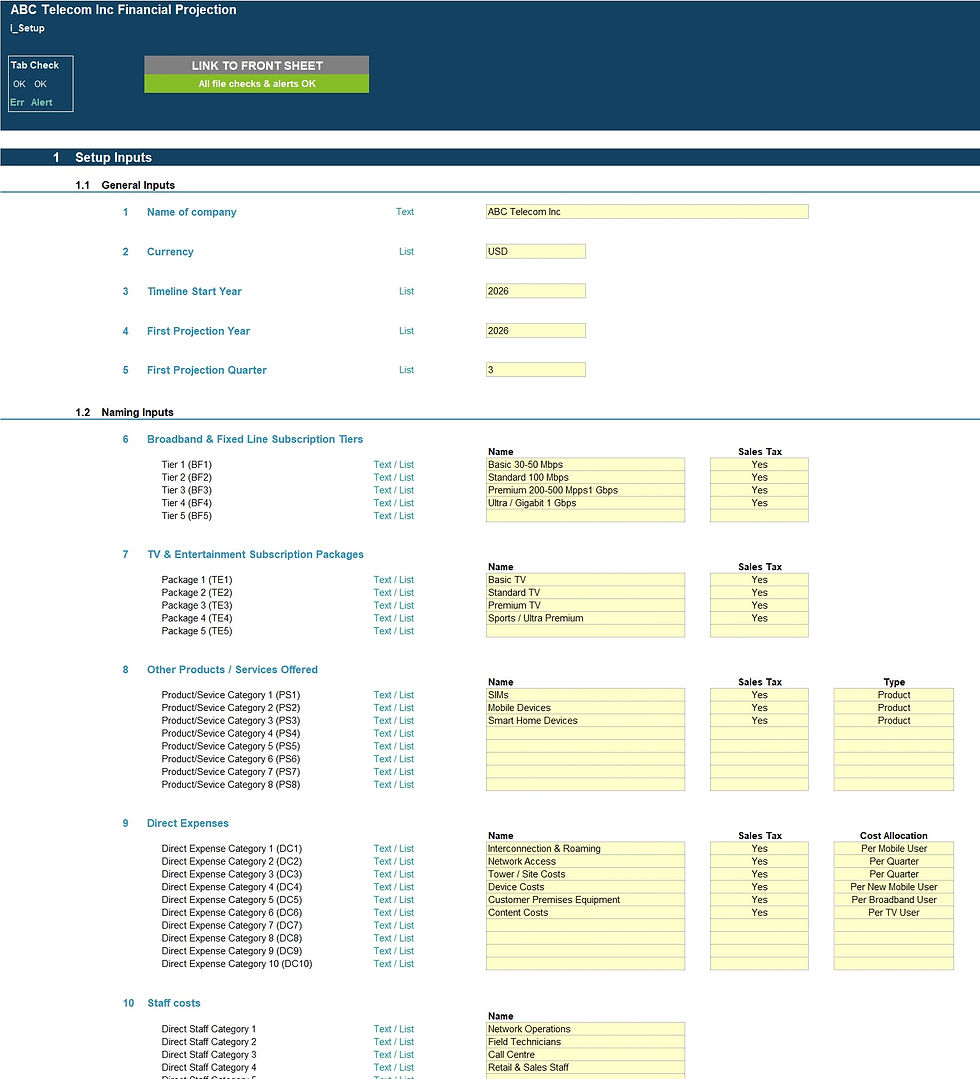
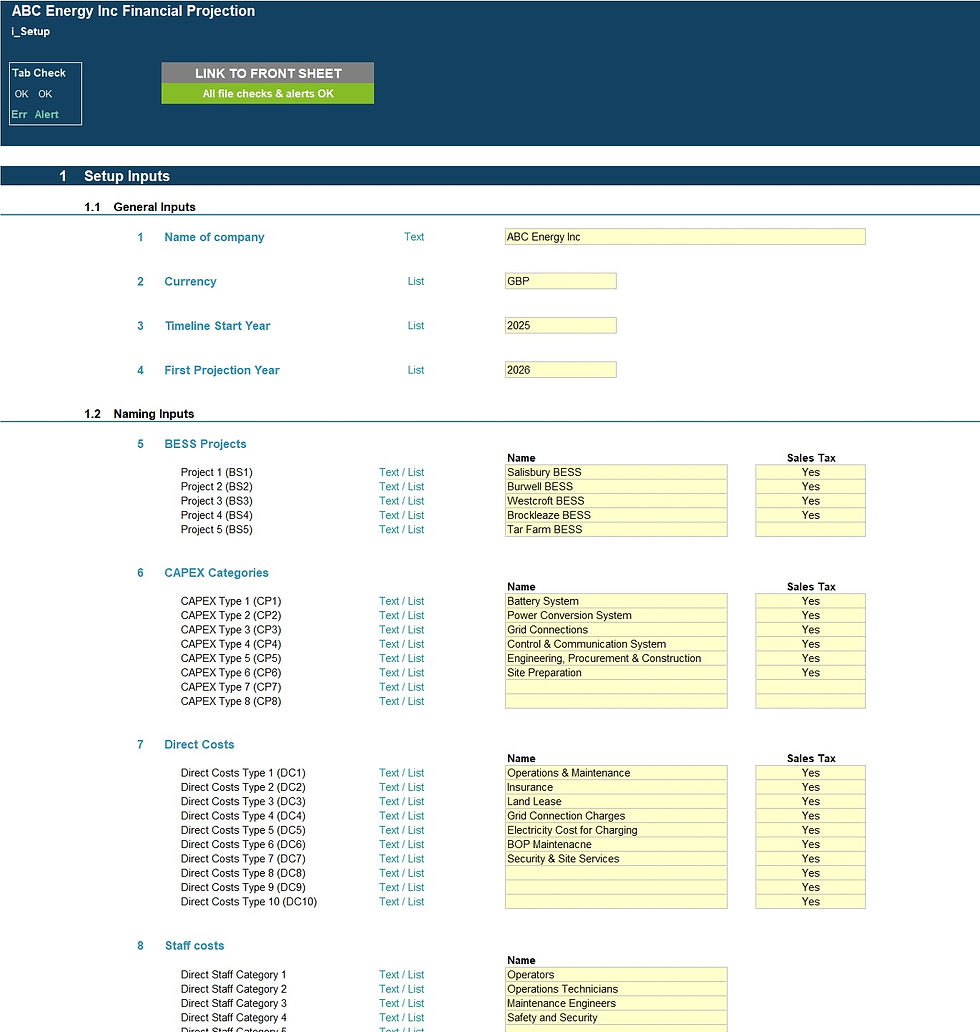
Setup Inputs:
- Name of business;
- Currency;
- First projection year;
- Naming for produce categories, variable cost categories, establishment costs, staff costs, other expenses, fixed assets and borrowings;
- Sales tax applicability for products, variable costs, other income and expenses and fixed assets.
Projection Inputs:
- Revenue inputs including sales volume, sales prices and average credit terms offered;
- Cost of goods inputs including cost per unit, safety stock percentage and average credit terms received;
- Variable cost inputs including percentage of revenue applicable to and cost percentage of revenue;
- Other costs inputs including staff costs, marketing costs and admin costs;
- Sales and corporate tax inputs including rate and payment periods;
- Dividend inputs including amount (percentage of retained earnings) and frequency;
- Fixed assets including addition amounts and useful life;
- Borrowings including addition amounts and interest rate;
- Share capital additions;
- Discount rate inputs (for valuation calculation).
MODEL STRUCTURE
The model comprises of 10 tabs split into input ('i_'), calculation ('c_'), output ('o_’) and system tabs. The tabs to be populated by the user are the input tabs ('i_Setup', ‘i_Assump_S1’ and 'i_Assump_S2'). The calculation tab uses the user-defined inputs to calculate and produce the projection outputs which are presented in 'o_Fin Stats', ‘o_Charts’ and ‘o_DCF’.
KEY FEATURES
- The model follows good practice financial modelling guidelines and includes instructions, line item explanations, checks and input validations;
- The model contains a flexible yearly timeline that is automatically updated based on starting projection year selected;
- The model allows the user to model up to 8 produce categories (4 fruit and 4 vegetable) with their own unique variable cost setup;
- The model is not password protected and can be modified as required following download;
- The model is reviewed using specialised model audit software to help reduce risk of formula inconsistencies;
- The model allows for the following number of underlying categories for each line item (these can be easily expanded if required):
- Produce categories – 8 categories;
- Variable cost categories – 10 categories;
- Staff costs – 5 categories;
- Establishment costs – 5 categories;
- Other expenses – 15 categories;
- Fixed assets – 15 categories;
- Borrowings – 3 facilities
- Apart from projecting revenue and costs the tool includes the possibility to model receivables and payables, fixed assets, borrowings, dividends and corporate tax;
- Business name, currency, starting projection period are fully customisable;
- Revenue, cost and fixed asset descriptions are fully customisable;
- The model allows the user to model 2 separate scenarios with own projected financial statement, valuation and dashboard outputs;
- The model included an integrated discounted cash flow valuation using the projected cash flow outputs;
- The model includes instructions, line item explanations, checks and input validations to help ensure input fields are populated accurately;
- The model includes a checks dashboard which summarises all the checks included in the various tabs making it easier to identify any errors.
MODIFICATIONS & SUPPORT
If you require any be-spoke modifications or support, we are more than happy to assist. Please send us a message below or contact us on hello@useprojectify.com
Orchard/Crop Farming Financial Projection - Excel Models
1 Populated Excel Model and 1 Unpopulated Excel Model


