

MODEL OVERVIEW
The Business Overview Model is a robust and intuitive financial model designed to provide a comprehensive snapshot of a company's historical performance and future outlook. Structured for clarity and flexibility, it serves as a powerful tool for internal analysis, investor presentations, or potential buyer due diligence.
Our highly versatile and user-friendly Excel model enables the preparation of a business overview with 5 years of historical actuals and 3 years of forward-looking projections, using an annual timeline. This industry-agnostic template is ideal for businesses seeking to present a well-rounded financial story. It includes detailed sections for list of key customers, key suppliers, expense categories, fixed assets, and borrowings to support in-depth business understanding and trend analysis.
The model includes a dynamic dashboard providing visual insights through charts and key performance indicators, including CAGR metrics, financial ratios, and summaries, making it perfect for inclusion in pitch decks or investment memos.
Key features include:
- The model supports full 3-statement financial forecasts (Income Statement, Balance Sheet, and Cash Flow) for the projected years.
- Support for multiple revenue streams and cost categories
- Includes fixed asset schedules, debt financing, corporate taxation, equity funding, and dividend distribution
- Built-in model integrity checks, input validations, and line-item instructions
- Designed in accordance with best-practice financial modelling standards
Whether you're preparing for strategic planning, an investor pitch, or an exit scenario, this model offers a clear and credible view of your business.
KEY OUTPUTS
- Projected full financial statements (Income Statement, Balance Sheet and Cash flow Statement) presented on an annual basis across 3 years;
- Dashboard with:
- Summarised projected Income Statement, Balance Sheet and Cash flow;
- Compounded Annual Growth Rate (CAGR) for each summarised income statement, balance sheet and cash flow line item;
- key ratios including average revenue growth, average profit margins, average return on assets and equity and average debt to equity ratio;
- Tables and charts summarising breakdowns by revenue stream/division, top customers, top suppliers, source country of purchases and expense breakdowns;
- Charts and graphs showing: cash balance by month, free cash flow generation, cash flow statement breakdown, profit margins, income statement breakdown, net cash vs net income, working capital and capital structure.
KEY INPUTS
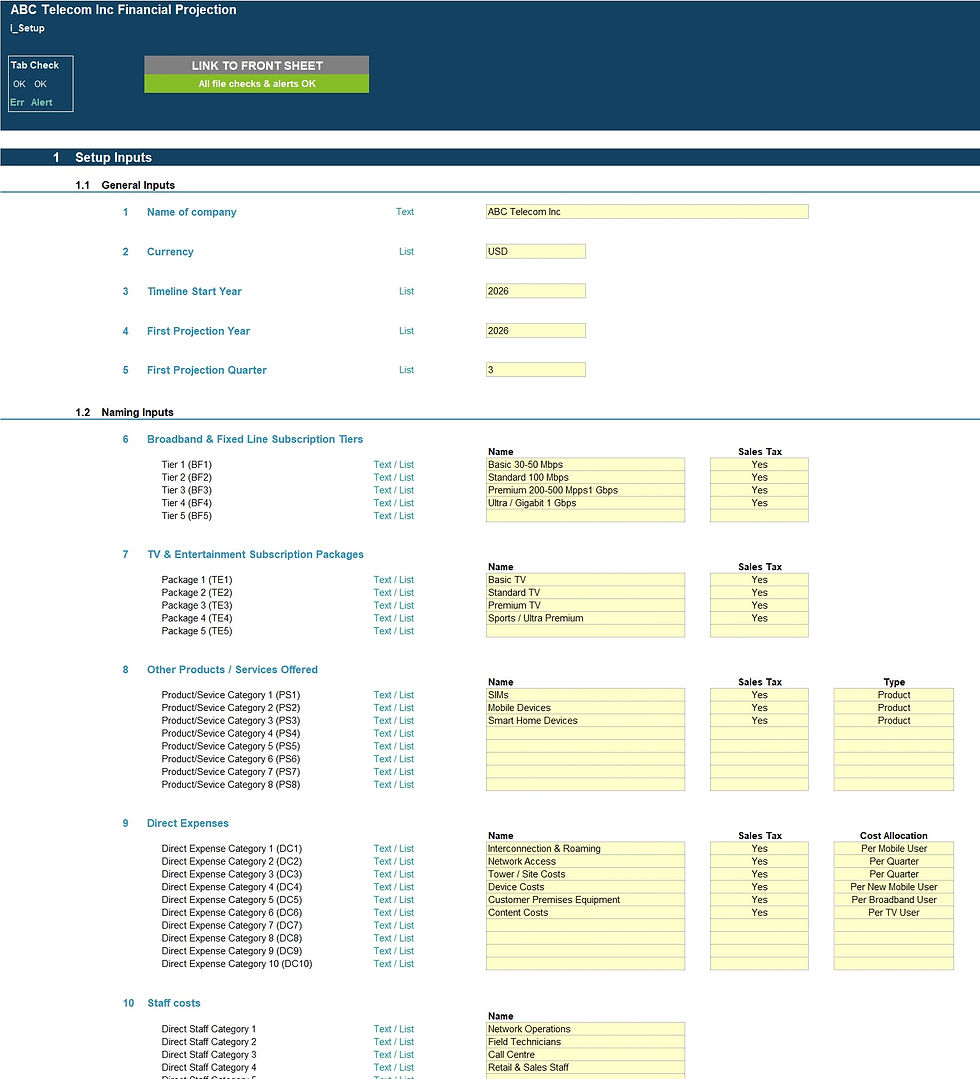
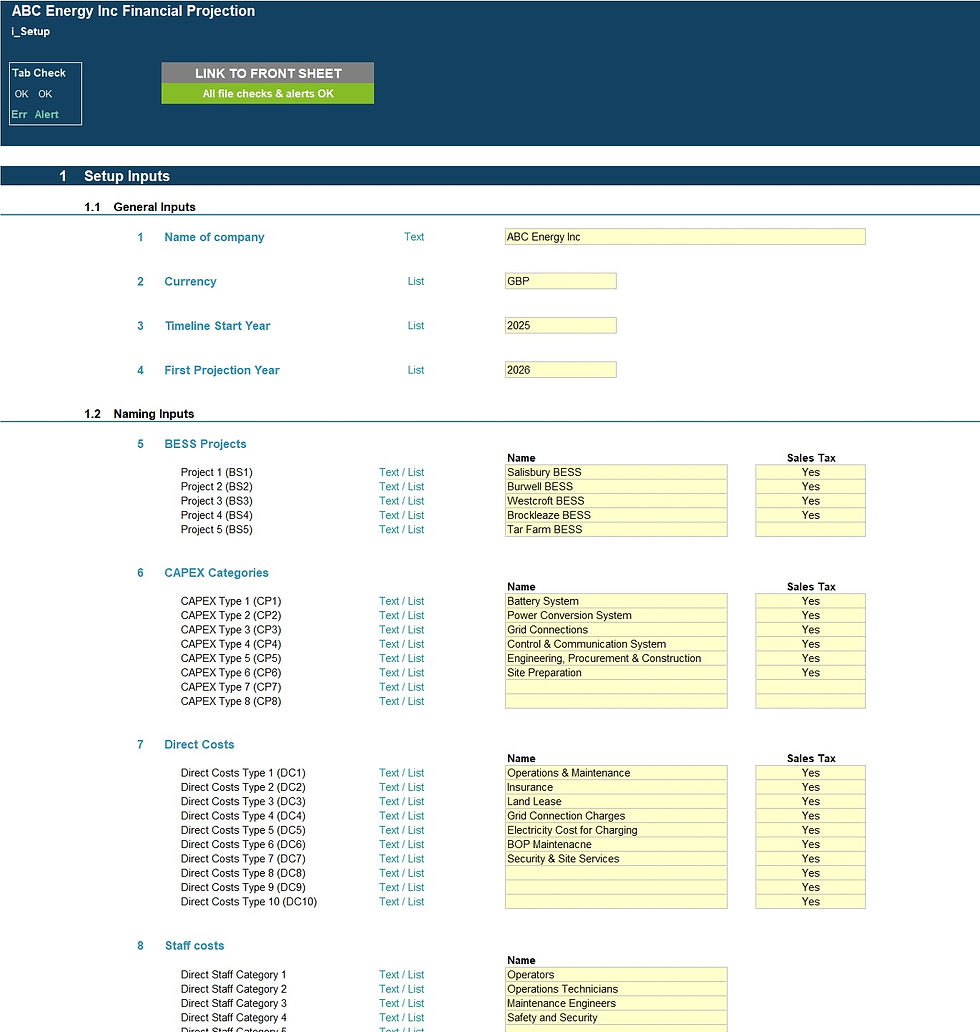
Setup Inputs:
- Name of business;
- Currency;
- Last Financial year end.
- Naming for divisions/revenue streams, top customers, top suppliers, expenses, fixed assets and borrowing facilities
Actuals Inputs:
- Opening balance sheet (for existing businesses);
- Income Statement actuals for past 5 years
- Balance sheet actuals for past 5 years
- Latest actual revenue broken down by top customers
- Latest purchases broken down by top suppliers.
Projection Inputs:
- Revenue and Other income per annum;
- Cost of sales percentages;
- Marketing costs and general/administrative expenses;
- Working capital assumptions including inventory % of cost of sales, average debtor day and average creditor days;
- corporate tax inputs including rate and payment periods;
- Dividends paid per annum;
- Noncurrent assets including addition amounts and useful life;
- Borrowings including addition amounts, interest rate and maturity date;
- Share capital additions;
MODEL STRUCTURE
The model comprises of 8 tabs split into input ('i_'), calculation ('c_'), output ('o_’) and system tabs. The tabs to be populated by the user are the input tabs ('i_Setup', ‘i_Actuals’ and 'i_Assumptions'). The calculation tab uses the user-defined inputs to calculate and produce the projection outputs which are presented in 'o_Fin Stats' and ‘o_Dashboard’.
KEY FEATURES
- The model contains an 8 year annual timeline with 5 years of actuals and 3 forecast years;
- The model is not password protected and can be modified as required following download;
- The model allows for the following number of underlying categories for each line item (these can be easily expanded if required):
- Revenue streams / divisions – 5 revenue streams;
- Marketing expenses – 5 categories
- General / Administrative expenses – 10 categories
- Fixed assets – 5 categories;
- Borrowings – 3 facilities
- Model includes a dynamic dashboard providing visual insights through charts and key performance indicators making it perfect for internal analysis, pitch decks or investment memos.
- Apart from projecting revenue and costs the model includes the functionality to model accounts receivable, accounts payable, inventory, fixed assets, borrowings, dividends and corporate tax;
- Business name, currency, starting projection period are fully customisable;
- Revenue, cost and fixed asset descriptions are fully customisable;
- The model includes instructions, line-item explanations, checks and input validations to help ensure input fields are populated accurately;
- The model includes a checks dashboard which summarises all the checks included in the various tabs making it easier to identify any errors.
SUPPORT / MODIFICATIONS
We are keen to ensure our customers are satisfied and find the models useful for their financial projection needs. Our models are developed with the user in mind and include instructions, line-item explanations, checks and input validations to ensure they are as user-friendly and easy to use as possible without requiring extensive knowledge of Microsoft Excel, finance or accounting. If any questions do arise, we are more than happy to assist. We are also happy to support with any be-spoke modifications you may require to the models to better suit your business needs. To get in touch, please send us a message through the website or contact us on: hello@useprojectify.com
Business Overview Excel Financial Model
1 Excel model with populated example and 1 blank Excel model


